Mock paper · Physiology SAQ Paper 1

Physiology
SAQ Paper 1

Six 10-mark questions with structured model answers, equations, diagrams and viva checks for MMed Anaesthesiology & Critical Care preparation.

Questions06
Total marks60
PreparedAug 2026
Question 01 · 10 marks

Acute haemorrhage and restoration of arterial pressure

A 35-year-old patient develops acute blood loss during surgery.
  1. Define mean arterial pressure (MAP) and state its principal physiological determinants. (2 marks)
  2. Describe the immediate cardiovascular responses to acute haemorrhage, including the role of the baroreceptor reflex. (4 marks)
  3. Explain the subsequent hormonal and renal mechanisms that contribute to restoration of arterial pressure and circulating volume. (4 marks)
View model answerQuestion first · answer when ready

a. Mean arterial pressure and determinants

2 marks

Definition: MAP is the time-weighted average arterial pressure over one cardiac cycle — the area under the arterial pressure–time curve divided by the cycle duration. It is the effective pressure driving systemic organ perfusion, and it is the pressure autoregulated by the baroreceptor reflex.

MAP − RAP = CO × SVR  →  MAP ≈ (CO × SVR) + RAP Right atrial pressure is the downstream pressure and is small enough to omit at the bedside. CO = HR × SV.

Normal values: MAP 70–105 mmHg; CO ≈ 5 L/min; SVR ≈ 800–1200 dyn·s·cm⁻⁵; RAP 2–6 mmHg.

The determinants are best given as a hierarchy, because the question asks for the principal ones and the marks sit in taking each branch one level down. Stopping at “cardiac output and systemic vascular resistance” answers half the question.

Determinants of mean arterial pressure, taken down to the physiological level
LevelDeterminantWhat sets it
OverallMAP ≈ CO × SVRThe two limbs. A fall in either lowers MAP unless the other rises.
Cardiac outputCO = HR × SVChronotropy and stroke volume.
→ Heart rateAutonomic balance at the SA nodeSympathetic β₁ acceleration against vagal slowing; intrinsic rate ≈ 100/min. Extreme tachycardia shortens diastolic filling time and reduces SV.
→ Stroke volumePreload — end-diastolic volumeThe Frank–Starling relationship: within physiological limits, greater EDV stretches the sarcomere towards its optimum length (≈2.2 µm), increases actin–myosin overlap and troponin C calcium sensitivity, and so increases the force of contraction and the stroke volume ejected. EDV is set by venous return, which depends on mean systemic filling pressure, venous capacitance and the pressure gradient back to the right atrium.
→ Stroke volumeAfterloadVentricular wall stress during ejection, by Laplace proportional to intracavitary pressure and radius and inversely to wall thickness. Approximated clinically by SVR and aortic impedance. A rise in afterload reduces stroke volume for a given contractility and preload.
→ Stroke volumeContractility (inotropy)Force generated at any given preload and afterload — the position of the Frank–Starling curve rather than the point on it. Increased by sympathetic β₁ stimulation and circulating catecholamines; reduced by ischaemia, acidosis, hypoxia and anaesthetic agents.
Systemic vascular resistancePoiseuille: R ∝ 8ηl / πr⁴Arteriolar radius is the dominant term because resistance varies with the fourth power — a small change in tone produces a large change in resistance. Also blood viscosity and vessel length. Set by sympathetic α₁ tone, local metabolites, endothelial mediators and circulating hormones.

Useful estimate: at a normal heart rate, MAP ≈ DBP + ⅓ (SBP − DBP), because diastole occupies roughly two-thirds of the cycle. The approximation fails in tachycardia, when diastole shortens disproportionately and MAP approaches the arithmetic mean.

b. Immediate cardiovascular responses

4 marks

This part is a sequence, and the marks follow the sequence. Work down it in order: the mechanical disturbance, what senses it, where that is integrated, what the efferent limbs do, and what is restored.

The immediate response to acute haemorrhage — seconds to minutes

Disturbance
Acute blood loss → ↓ circulating volume, and specifically ↓ stressed volume
Mechanics
↓ mean systemic filling pressure → ↓ pressure gradient for venous return → ↓ venous return → ↓ right and left ventricular end-diastolic volume (preload)
Frank–Starling
Reduced EDV moves the ventricle down its Frank–Starling curve → ↓ stroke volume → ↓ cardiac output, ↓ pulse pressure, ↓ MAP, ↓ CVP

The fall in pressure is detected at three sites

High pressure
Carotid sinus baroreceptors → glossopharyngeal nerve (IX). Aortic arch baroreceptors → vagus (X). Reduced stretch → reduced afferent firing.
Low pressure
Atrial and great vein stretch receptors and ventricular mechanoreceptors → reduced firing with reduced filling.
Chemical
With more severe loss, peripheral chemoreceptors respond to stagnant hypoxia and acidosis, reinforcing sympathetic outflow.
Integration
Afferents converge on the nucleus tractus solitarius in the medulla. Reduced baroreceptor input disinhibits the vasomotor centre → ↑ sympathetic outflow and ↓ vagal outflow.

Efferent limbs

Heart · β₁
↑ heart rate (positive chronotropy) and ↑ contractility (positive inotropy), both raising cardiac output for a given preload.
Arterioles · α₁
↑ SVR. Constriction is selective — cutaneous, splanchnic, renal and skeletal muscle beds constrict; cerebral and coronary beds are relatively spared, so flow is redistributed to heart and brain.
Veins · α₁
Venoconstriction reduces venous capacitance and converts unstressed to stressed volume, raising mean systemic filling pressure and supporting venous return — the most important single compensation.
Capillary
Transcapillary refill. Arteriolar constriction lowers capillary hydrostatic pressure, so the Starling balance shifts towards absorption. Interstitial fluid moves into the plasma at up to about 0.5–1 mL/min, partly restoring volume — at the cost of dilution.
Net effect
Cardiac output and MAP are partly restored. In a healthy adult, losses up to about 15% of blood volume may leave the blood pressure near normal — a normal blood pressure does not exclude significant haemorrhage. Tachycardia, narrowed pulse pressure and cool peripheries appear first.
If loss continues
With severe hypotension (MAP below about 50 mmHg), medullary ischaemia triggers the CNS ischaemic response, a maximal sympathetic discharge. A subset of patients instead show the Bezold–Jarisch reflex: a near-empty vigorously contracting ventricle stimulates ventricular mechanoreceptors, producing paradoxical bradycardia and vasodilatation.
The commonest way to lose marks here is to jump from “blood loss” straight to “tachycardia and vasoconstriction”, missing the sensing and integration steps in between. The delayed hormonal and renal responses belong in part (c) and earn nothing if written here.

c. Hormonal and renal restoration

4 marks

Four systems, each with a trigger, a mediator, an action and a timescale. Setting them out that way keeps the answer organised and makes the marks easy to award.

Hormonal and renal responses to hypovolaemia
SystemTriggerActionOnset
RAASThree converging signals on the juxtaglomerular cells: ↓ renal perfusion pressure (intrarenal baroreceptor), β₁ sympathetic stimulation, and ↓ NaCl delivery sensed by the macula densaRenin → angiotensinogen to angiotensin I → ACE (pulmonary endothelium) → angiotensin IIMinutes
Angiotensin IIAT₁ receptorsSystemic arteriolar vasoconstriction (↑ SVR); preferential efferent arteriolar constriction preserving glomerular capillary pressure and hence GFR; ↑ proximal tubular Na⁺/H⁺ exchange; stimulates thirst, ADH and aldosterone; ↑ sympathetic outflowMinutes
AldosteroneAngiotensin II; hyperkalaemia; ACTHActs on principal cells of the late distal tubule and collecting duct: ↑ ENaC and basolateral Na⁺/K⁺-ATPase. Sodium and, with ADH, water are conserved; K⁺ and H⁺ are secretedHours (genomic)
ADH (vasopressin)↓ atrial and arterial stretch, plus angiotensin II and ↑ plasma osmolality. Volume depletion overrides osmotic controlV₂ on collecting-duct principal cells → Gs–cAMP → aquaporin-2 insertion into the apical membrane → water reabsorbed down the medullary gradient, concentrated urine. At high concentration V₁ causes vasoconstrictionMinutes to hours
Sympathetic — renalDirect renal nerve activityAfferent arteriolar constriction reduces RBF and GFR and hence filtered sodium load; direct stimulation of proximal tubular sodium reabsorptionSeconds
ANP / BNPReduced atrial and ventricular stretchReduced secretion — withdrawal of a natriuretic, vasodilating and renin-suppressing signal, so its fall reinforces conservationMinutes
Other hormonesStress responseAdrenaline and noradrenaline from the adrenal medulla sustain the neural response; cortisol supports vascular reactivity; glucagon and growth hormone mobilise substrateMinutes to hours
ErythropoietinRenal cortical hypoxiaStimulates erythropoiesis to restore red-cell mass — the slowest limb, and the only one that restores oxygen-carrying capacity rather than volumeDays to weeks

Net renal effect: GFR and urine flow fall, urine becomes concentrated with a low sodium concentration, and the fractional excretion of sodium falls below 1%. Thirst and ADH restore water while aldosterone and angiotensin II restore sodium, so extracellular volume, venous return, cardiac output and arterial pressure are progressively restored over hours to days. Red-cell mass takes weeks — which is why the haematocrit falls as the volume is replaced.
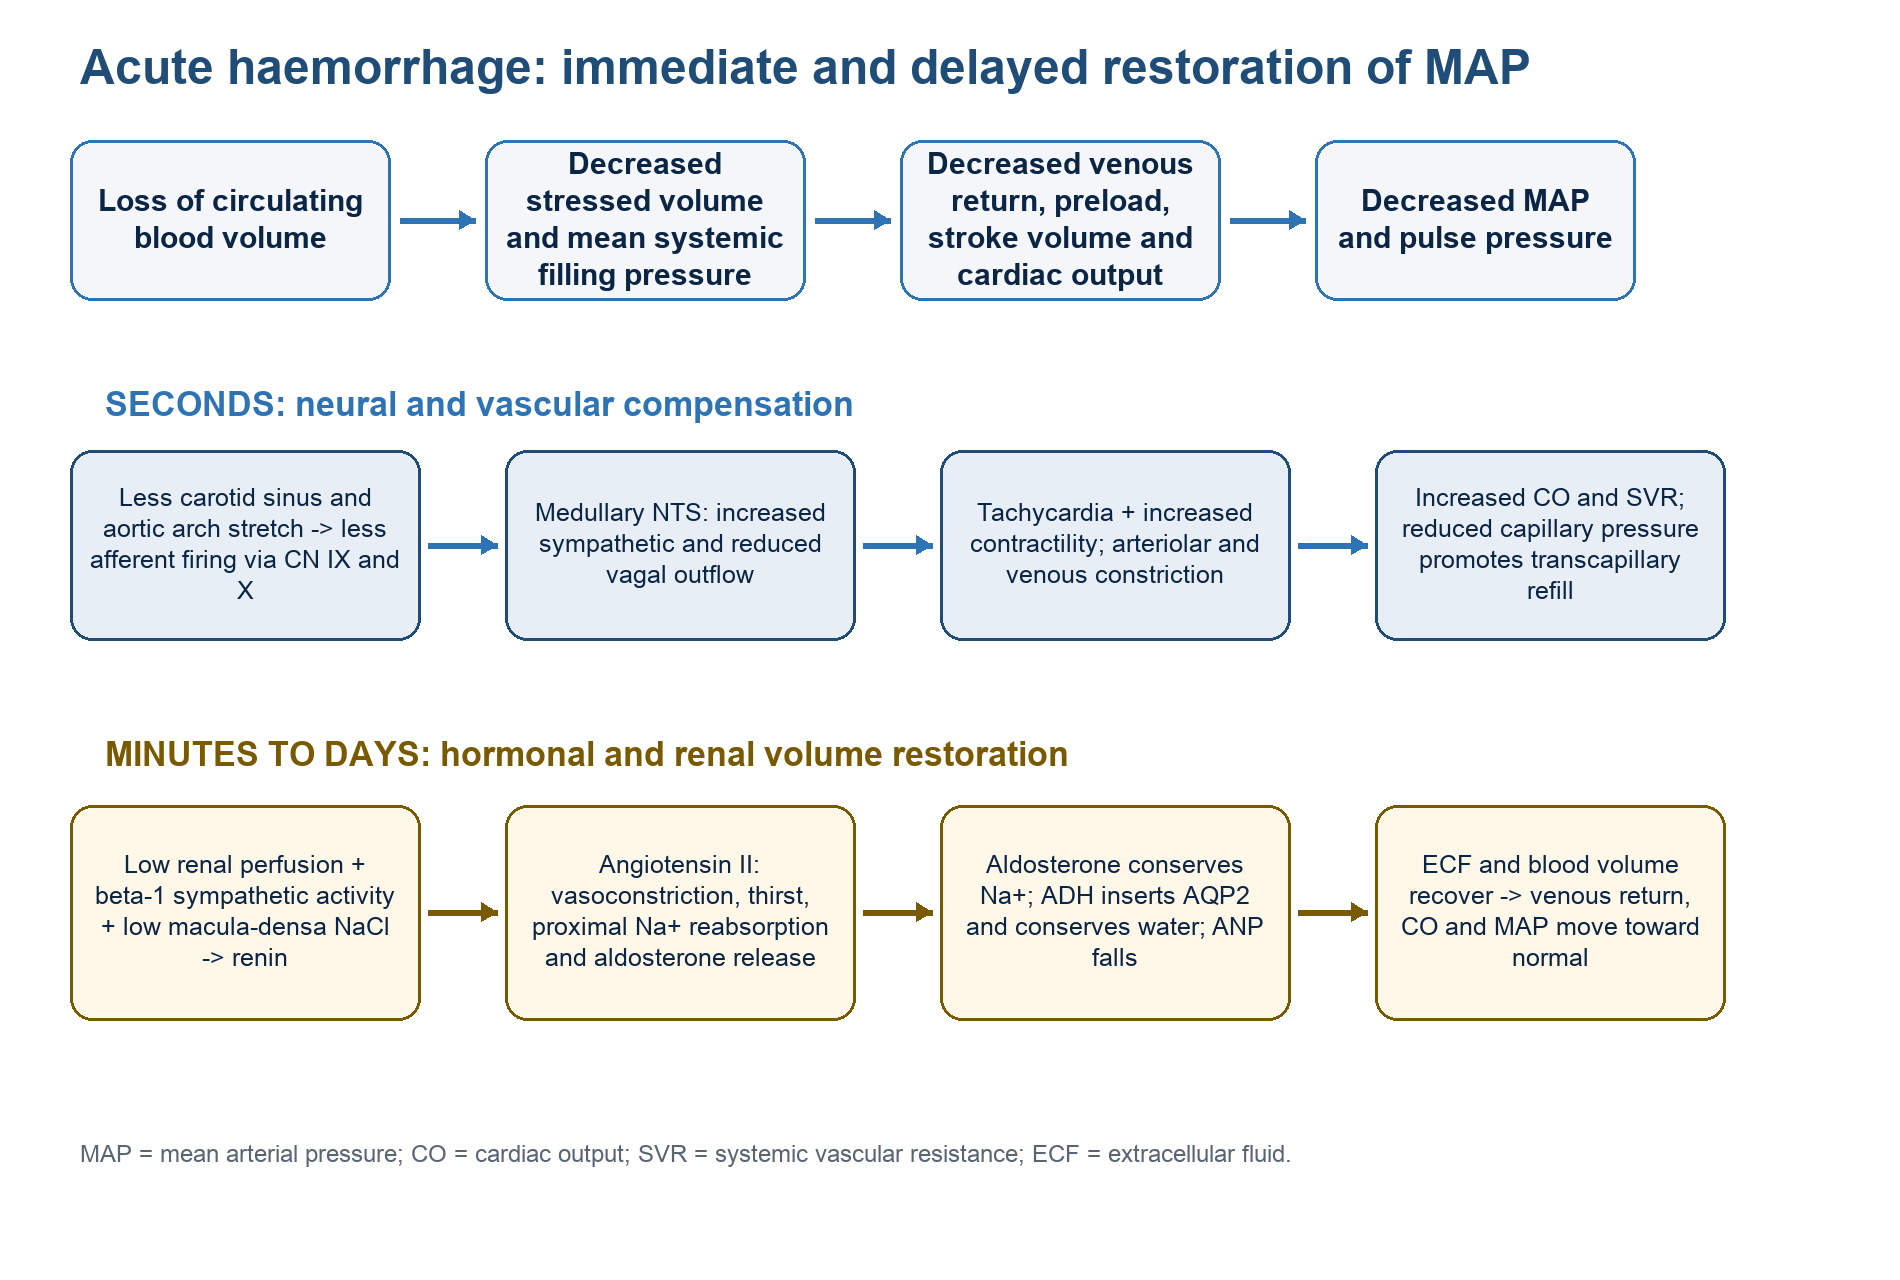
Flow diagram showing immediate neural and delayed hormonal responses to acute haemorrhage
Acute haemorrhage: immediate and delayed compensatory responses
Question 02 · 10 marks

Ventilation–perfusion matching and pneumonia

A patient with unilateral pneumonia develops arterial hypoxaemia.
  1. Define the ventilation–perfusion (V/Q) ratio and state its approximate value for the whole lung in a healthy adult. (2 marks)
  2. Explain regional differences in ventilation and perfusion from the apex to the base in the upright lung. (4 marks)
  3. Explain how V/Q mismatch produces hypoxaemia and describe the physiological role of hypoxic pulmonary vasoconstriction. (4 marks)
View model answerIncludes two diagrams

a. Definition and whole-lung value

2 marks
V/Q = alveolar ventilation (V̇A) / pulmonary perfusion (Q̇)At rest V̇A ≈ 4 L/min and Q̇ ≈ 5 L/min, so whole-lung V/Q ≈ 0.8.

Definition: the ventilation–perfusion ratio is the ratio of the alveolar ventilation reaching gas-exchanging units to the pulmonary blood flow perfusing those units. It is the single variable that determines the composition of alveolar and hence end-capillary gas, and it can be stated for the whole lung, for a region, or for a single alveolar unit.

Whole-lung value: approximately 0.8 (quoted 0.8–1.0 depending on the normal values used). Use alveolar ventilation, not minute ventilation — minute ventilation of about 5 L/min includes roughly 150 mL of dead space per breath, and using it gives about 1.0 and a different answer.

The two extremes of the V/Q spectrum, and where each sits
V/QStateGas composition of blood leavingClinical example
0Shunt — perfused but not ventilatedSame as mixed venous: PO₂ 40 mmHg, PCO₂ 46 mmHgConsolidation, atelectasis, complete airway obstruction
< 0.8Low V/Q unit↓ PO₂, ↑ PCO₂ — the cause of hypoxaemia in most lung diseaseDependent lung, bronchospasm, partial obstruction
≈ 0.8Normal whole lungPO₂ 100 mmHg, PCO₂ 40 mmHgThe healthy resting adult
> 0.8High V/Q unit↑ PO₂, ↓ PCO₂ — but adds little content, see part (c)Apex of the upright lung, hypovolaemia
Alveolar dead space — ventilated but not perfusedSame as inspired gas: PO₂ 150 mmHg, PCO₂ 0Pulmonary embolism, West zone 1, excessive PEEP

b. Apex-to-base gradients

4 marks

Draw the graph first — it is worth more per second of writing than any paragraph in this question, and it organises everything that follows.

0.000.050.100.150.2001232345Perfusion (Q̇)Ventilation (V̇A)V̇A/Q̇L/min per % lung volumeVentilation–perfusion ratioRib numberAPEX (top)BASE (bottom)3rd rib — all three lines meet, V/Q = 1Apex — V/Q ≈ 3 · PO₂ ≈ 130 mmHg · PCO₂ ≈ 28 mmHg · larger alveoli, less compliant, least perfusedBase — V/Q ≈ 0.6 · PO₂ ≈ 90 mmHg · PCO₂ ≈ 42 mmHg · smaller alveoli, more compliant, best perfused
Original teaching diagramVentilation, perfusion and V/Q from apex to base, upright lung. Both ventilation and perfusion increase towards the base — the examinable point is that perfusion increases more steeply. Where the two lines cross, at about the third rib, V/Q = 1. Above it V/Q rises steeply towards the apex; below it V/Q falls towards the base. Draw the axes with units, both straight lines, the crossing point and the rising V/Q curve, and the marks are earned.
Why ventilation and perfusion both increase towards the base, and why perfusion increases more
VentilationPerfusion
Underlying causeGravity creates a vertical gradient of intrapleural pressure — about −10 cmH₂O at the apex against −2.5 cmH₂O at the baseGravity creates a vertical hydrostatic gradient of pulmonary vascular pressure — roughly 1 cmH₂O per cm of lung height
MechanismThe more negative apical pressure holds apical alveoli larger at FRC, so they sit on the flatter, less compliant upper part of the pressure–volume curve. Basal alveoli start smaller on the steep, compliant portionHigher pressure in the dependent lung progressively recruits collapsed capillaries and distends open ones, lowering resistance
ConsequenceBasal alveoli undergo a greater change in volume per unit pressure — ventilation per unit lung volume is greater at the baseBlood flow per unit lung volume is greater at the base
SteepnessIncreases modestly from apex to baseIncreases much more steeply — this difference is what creates the V/Q gradient

The West zones describe the same hydrostatic gradient in terms of the relationship between pulmonary arterial (Pa), alveolar (PA) and pulmonary venous (Pv) pressures. They explain the perfusion line, and are worth naming.

West zones of the upright lung
ZonePressure relationshipFlow
1 — apexPA > Pa > PvNo flow: alveolar pressure collapses the capillary. Alveolar dead space. Not present in the normal upright lung, but appears with hypovolaemia, high PEEP or IPPV
2 — midPa > PA > PvIntermittent, driven by the arterial-to-alveolar difference — the Starling resistor. Flow increases down the zone as Pa rises
3 — basePa > Pv > PAContinuous, driven by the normal arteriovenous difference. Flow increases further down the zone through vessel distension
4 — most dependentPa > Pinterstitial > PvFlow falls again: increased interstitial pressure compresses extra-alveolar vessels. Prominent at low lung volumes and in pulmonary oedema

Resulting V/Q gradient: because the perfusion gradient is the steeper of the two, V/Q is high at the apex (≈3), passes through 1 at about the third rib, and is low at the base (≈0.6). The apex is therefore relatively over-ventilated and under-perfused, with a higher alveolar PO₂ (≈130 mmHg) and lower PCO₂ (≈28 mmHg); the base is the reverse (PO₂ ≈90 mmHg, PCO₂ ≈42 mmHg). Most of the total ventilation and most of the total blood flow both go to the base — the apex is simply less mismatched in the direction that matters for oxygenation.

c. Hypoxaemia and hypoxic pulmonary vasoconstriction

4 marks
How V/Q mismatch produces hypoxaemia
StepWhat happens
1 · The lesionConsolidated alveoli in the pneumonic lobe are poorly ventilated but remain perfused — low V/Q units, tending towards true shunt where ventilation is abolished altogether
2 · End-capillary gasBlood leaving those units equilibrates with alveolar gas of low PO₂ and high PCO₂, so it has a low saturation and, critically, a low oxygen content
3 · AdmixtureThis blood mixes with blood from normal lung in the pulmonary veins and left atrium. Contents add; partial pressures do not. The mixed arterial content falls, and PaO₂ falls with it
4 · No compensationBlood from well-ventilated units is already on the flat plateau of the oxyhaemoglobin dissociation curve at 97–98% saturation. Raising its PO₂ adds only dissolved oxygen — about 0.003 mL/dL per mmHg — which cannot offset the content deficit from the low-V/Q blood
5 · Why CO₂ is differentCarbon dioxide is largely spared because the CO₂ dissociation curve is steeper and more nearly linear over the physiological range, so hyperventilating normal units genuinely does clear extra CO₂. PaCO₂ is therefore normal or low while PaO₂ is low

Response to added oxygen — the discriminator. Increasing the inspired oxygen fraction raises alveolar and end-capillary PO₂ in low-V/Q units, because some ventilation still reaches them, so hypoxaemia due to V/Q mismatch improves. A true shunt (V/Q = 0) responds poorly, because no inspired gas reaches the perfused unit at any FiO₂. Do not call V/Q inequality a shunt: they behave differently, and the difference is diagnostically useful at the bedside.

Hypoxic pulmonary vasoconstriction
Detail
StimulusLow alveolar PO₂ is the principal stimulus (mixed venous PO₂ contributes). The response begins below about 100 mmHg and is near-maximal around 30 mmHg
SiteSmall pre-capillary pulmonary arteries and arterioles, which lie close enough to alveoli to sense alveolar gas
MechanismHypoxia inhibits oxygen-sensitive voltage-gated K⁺ channels in pulmonary vascular smooth muscle → membrane depolarisation → opening of L-type Ca²⁺ channels → Ca²⁺ entry → contraction. Mitochondrial redox signalling and reactive oxygen species act as the sensor
Time courseBiphasic — onset within seconds, a first phase maximal at about 15 minutes, and a second sustained phase developing over hours
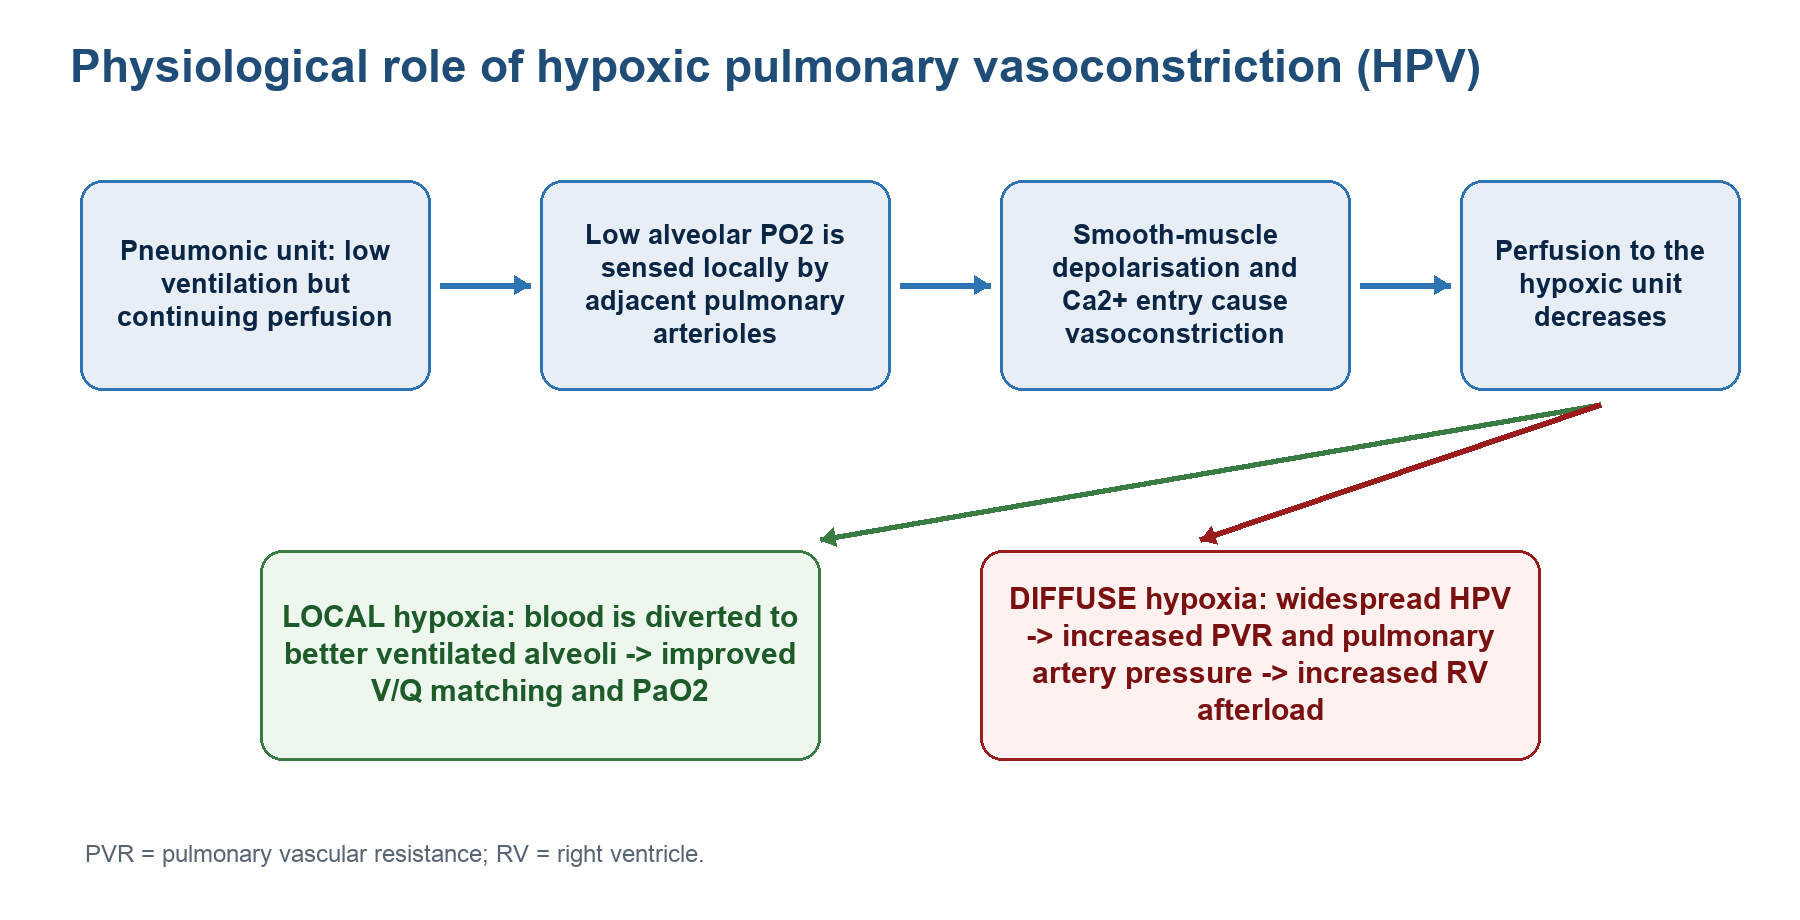
PurposeDiverts perfusion away from hypoxic alveoli towards better-ventilated regions, improving V/Q matching and limiting the fall in PaO₂. It is the only vascular bed that constricts rather than dilates in response to hypoxia
Local benefitIn regional disease — this pneumonia, or one-lung ventilation — it is protective and can reduce shunt fraction substantially
Diffuse costWhen alveolar hypoxia is global (altitude, chronic lung disease, hypoventilation), widespread vasoconstriction raises pulmonary vascular resistance and pulmonary artery pressure, increases right ventricular afterload, and over time produces right ventricular hypertrophy and cor pulmonale
Inhibited byVolatile anaesthetic agents, calcium channel blockers, nitrates, sodium nitroprusside, phosphodiesterase inhibitors, β₂ agonists, hypocapnia, alkalosis, high or very low pulmonary artery pressure, and infection — relevant because several are given to exactly these patients
Enhanced byHypercapnia, acidosis and sympathetic stimulation
Flow diagram showing the local benefit and diffuse cost of hypoxic pulmonary vasoconstriction
Local benefit and diffuse cost of HPV
Question 03 · 10 marks

Cerebral perfusion pressure and cerebral blood flow

A patient with traumatic brain injury develops an increase in intracranial pressure.
  1. Define CPP and state its relationship with MAP and ICP. (2 marks)
  2. Describe the factors that determine cerebral blood flow. (4 marks)
  3. Explain the effects of PaCO₂, PaO₂ and arterial blood pressure on cerebral blood flow. (4 marks)
View model answerIncludes key CBF curves

a. CPP definition and relationship

2 marks

Definition: cerebral perfusion pressure is the net pressure gradient driving blood through the cerebral circulation — the difference between the inflow pressure and the effective downstream pressure.

CPP = MAP − ICP  (or CVP, whichever is higher)CBF = CPP / CVR. Normal CPP 60–80 mmHg; ICP 5–13 mmHg; CBF ≈ 50 mL/100 g/min.
Determinants of cerebral perfusion pressure and cerebral blood flow
TermNormal valueWhat it means and why it matters
MAP70–105 mmHgThe inflow pressure. Measured at the level of the tragus when the head is elevated, not at the heart — a 20 cm height difference is about 15 mmHg of CPP
ICP5–13 mmHgThe downstream pressure in the rigid cranium. Governed by the Monro–Kellie doctrine: brain, blood and CSF occupy a fixed volume, so a rise in one must be offset by a fall in another or ICP rises
CVP2–6 mmHgBecomes the relevant downstream pressure whenever it exceeds ICP — for example with high PEEP, jugular obstruction or head-down positioning
CPP60–80 mmHgThe driving pressure. Below about 50 mmHg autoregulation is exhausted and ischaemia begins; a threshold of 60–70 mmHg is usually targeted after traumatic brain injury
CVRCerebral vascular resistance, set overwhelmingly by arteriolar radius. By Poiseuille R ∝ 1/r⁴, so a 20% fall in radius roughly doubles resistance
CBF50 mL/100 g/min≈750 mL/min, about 15% of cardiac output for 2% of body weight. Grey matter ≈80, white matter ≈20 mL/100 g/min
Ischaemic thresholdsBelow 20–25 mL/100 g/min the EEG slows; below 15 it becomes flat; below 10 membrane failure and infarction follow. The gap between the last two is the ischaemic penumbra

A rise in ICP therefore reduces CPP unless MAP rises equally — which is the physiological basis of the Cushing reflex: hypertension to defend CPP, with reflex bradycardia and irregular respiration.

b. Determinants of cerebral blood flow

4 marks

Group the determinants rather than listing them, and keep to physiology — this question does not ask about anaesthetic agents.

How cerebral blood flow is controlled

The relationship
CBF = CPP / CVR — flow can change only if the driving pressure changes or the resistance changes

Four physiological controllers, all acting on arteriolar tone

1 · Myogenic
Autoregulation. Vascular smooth muscle contracts when stretched by a rise in transmural pressure and relaxes when it falls, holding CBF near constant over CPP ≈50–150 mmHg
2 · Metabolic
Flow–metabolism coupling. Neuronal activity raises CMRO₂ and releases CO₂, H⁺, adenosine, K⁺, nitric oxide and lactate, which dilate local arterioles and match regional flow to demand
3 · Chemical
PaCO₂ is the most powerful single influence, acting through CSF pH. PaO₂ has no effect until it falls below about 50–60 mmHg, then dilates steeply
4 · Neurogenic
Sympathetic fibres from the superior cervical ganglion constrict; parasympathetic and trigeminal fibres dilate. Mainly shifts the upper limit of autoregulation, protecting against hypertensive breakthrough
Modifying factors
Viscosity and haematocrit — flow rises as haematocrit falls, though oxygen delivery is optimal around 30–34%. Cerebral venous pressure — raised by jugular compression, coughing, PEEP or head-down tilt. Temperature — CMRO₂ and therefore CBF change by roughly 6–7% per °C. Blood viscosity and vessel calibre in disease
Net
All converge on arteriolar radius. Because resistance varies with the fourth power of radius, modest changes in tone produce large changes in flow
Every mechanism acts by the same final common path — a change in arteriolar radius, and therefore in cerebral vascular resistance. Saying so explicitly ties the answer together and is worth a mark on its own.

Autoregulation in detail. The plateau runs from a CPP of about 50 to 150 mmHg. It is shifted to the right by chronic hypertension — so a “normal” pressure may be ischaemic in a chronically hypertensive patient — and to the left in the neonate. It takes 30–120 seconds to respond, so it does not protect against abrupt swings. It is impaired or abolished by traumatic brain injury, ischaemia, subarachnoid haemorrhage, hypercapnia and volatile agents, after which flow becomes pressure-passive and follows MAP directly.

c. PaCO₂, PaO₂ and arterial pressure

4 marks
The three relationships, with the numbers that earn the marks
VariableRelationshipMechanismClinical consequence
PaCO₂Linear across roughly 20–80 mmHg, with plateaus at both extremes. CBF changes about 1–2 mL/100 g/min per mmHg, or roughly 2–4% per mmHgCO₂ crosses the blood–brain barrier freely (H⁺ and HCO₃⁻ do not). It is hydrated to carbonic acid in CSF, lowering perivascular pH; H⁺ relaxes arteriolar smooth muscleHypercapnia raises CBF, cerebral blood volume and ICP. Hyperventilation lowers them — but the effect wanes over 6–24 h as CSF bicarbonate is adjusted, and abrupt normalisation then causes rebound hyperaemia
PaO₂Flat above about 50–60 mmHg, then steeply rising as PaO₂ falls further. CBF may double by a PaO₂ of 30 mmHgTissue hypoxia releases adenosine, opens ATP-sensitive K⁺ channels and generates nitric oxide and lactate, all vasodilating. A threshold rather than a graded responsePreserves oxygen delivery when content is falling. Note that CBF does not fall as PaO₂ drops below the threshold — a common error. Marked hyperoxia causes mild vasoconstriction, reducing CBF by around 10%
MAP / CPPPlateau between CPP ≈50 and 150 mmHg, pressure-passive outside itMyogenic reflex in arteriolar smooth muscle: stretch opens cation channels, raises intracellular calcium and causes constriction; the reverse on relaxationBelow the lower limit, flow falls and ischaemia follows. Above the upper limit, forced dilatation causes hyperaemia, breakdown of the blood–brain barrier and oedema. Chronic hypertension shifts both limits right; TBI may abolish the plateau entirely
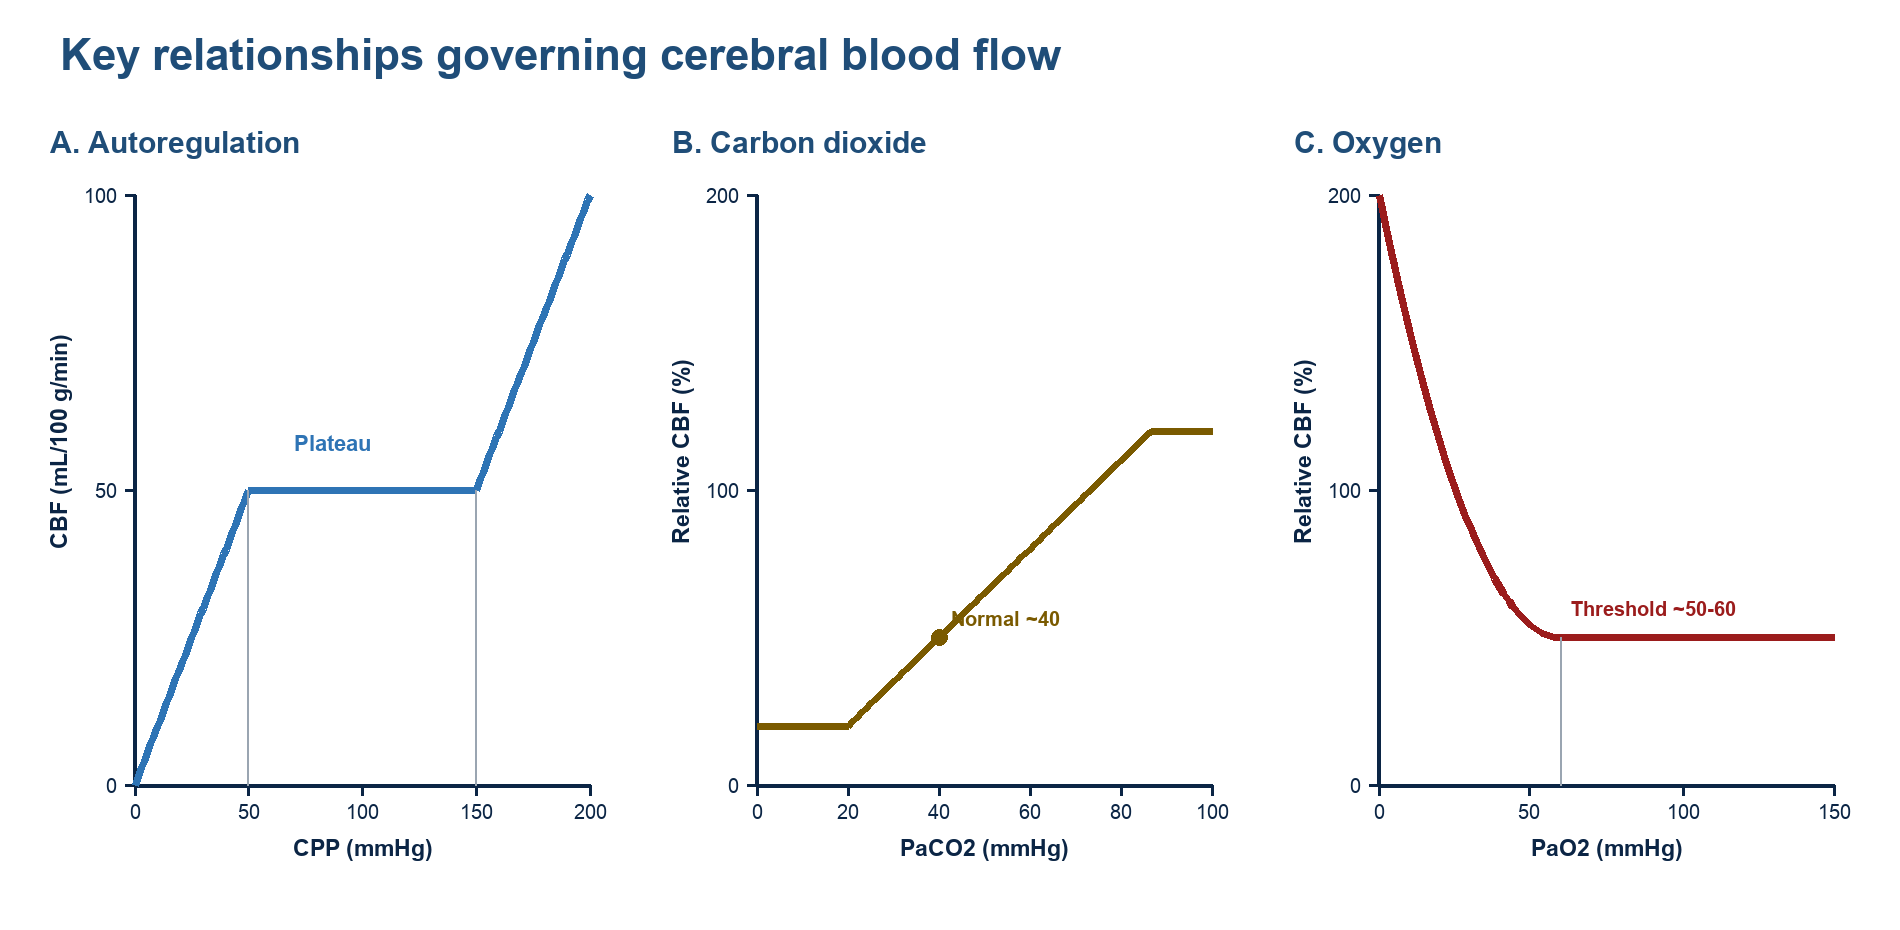
Three graphs showing cerebral autoregulation and the effects of carbon dioxide and oxygen on cerebral blood flow
Key relationships governing cerebral blood flow

Drawing these. Three separate graphs, each with CBF in mL/100 g/min on the y-axis. Put PaCO₂, PaO₂ or CPP in mmHg on the x-axis, mark the normal point, and label the values at which the shape changes — 50–150 mmHg for the autoregulation plateau, 50–60 mmHg for the oxygen threshold, 20–80 mmHg for the linear carbon dioxide range. Do not draw a plateau-shaped autoregulation curve for PaCO₂: the carbon dioxide relationship is linear in the physiological range, and drawing it as a plateau is a specific and commonly penalised error.

Question 04 · 10 marks

Glomerular filtration and renal conservation in hypovolaemia

A patient who has undergone major abdominal surgery develops oliguria.
  1. Define GFR and state its principal determinants. (3 marks)
  2. Describe the physiological mechanisms regulating renal blood flow and GFR. (3 marks)
  3. Explain how ADH and RAAS conserve sodium and water during hypovolaemia. (4 marks)
View model answerIncludes Starling forces and autoregulation

a. Definition and determinants

3 marks

Definition: the glomerular filtration rate is the volume of protein-free ultrafiltrate formed by all functioning glomeruli per unit time. Normally 120–125 mL/min/1.73 m², about 180 L/day, of which more than 99% is reabsorbed to leave 1–2 L of urine.

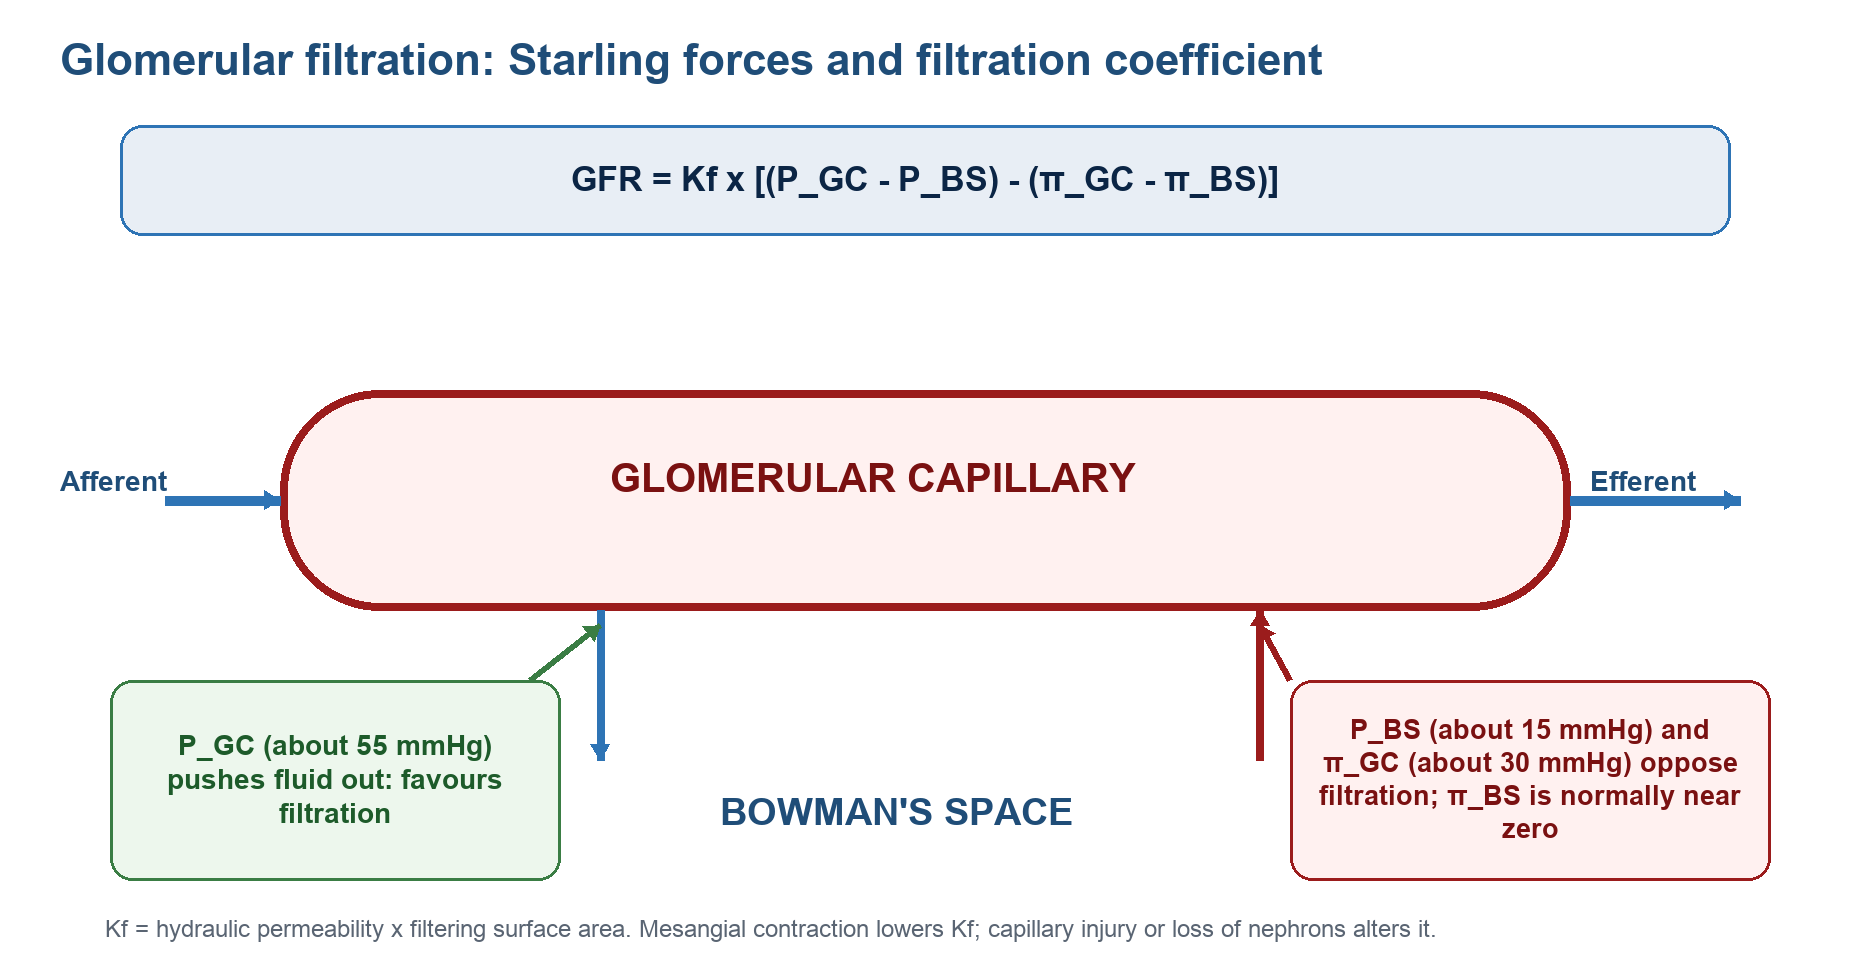
GFR = Kf × [(PGC − PBS) − (πGC − πBS)]Net filtration pressure ≈ 55 − 15 − 30 = 10 mmHg at the afferent end. Kf = hydraulic conductivity × surface area.
The Starling forces across the glomerular capillary, with values and direction
ForceSymbolValueDirectionNotes
Glomerular capillary hydrostatic pressurePGC≈ 55 mmHgFavours filtrationThe dominant force. High for a capillary bed because the glomerulus sits between two arterioles. Falls little along the capillary
Bowman's space hydrostatic pressurePBS≈ 15 mmHgOpposesRises sharply in ureteric obstruction, which is why obstruction reduces GFR
Glomerular capillary oncotic pressureπGC≈ 30 mmHg rising to ≈ 35OpposesRises along the capillary as protein-free fluid is filtered and plasma protein is concentrated. This is what brings net filtration towards zero at the efferent end — filtration equilibrium
Bowman's space oncotic pressureπBS≈ 0NegligibleThe healthy filtration barrier excludes protein. Rises in glomerular disease with proteinuria
Net filtration pressure≈ 10 mmHgFiltrationSmall, and therefore vulnerable — modest changes in any component alter GFR
Filtration coefficientKfMultiplierHydraulic conductivity × surface area. Roughly 100× that of skeletal muscle capillaries. Reduced by mesangial cell contraction (angiotensin II, endothelin) and by loss of functioning glomeruli

The filtration barrier has three layers, and all three contribute to selectivity: the fenestrated capillary endothelium (70–100 nm pores, excludes cells), the glomerular basement membrane (type IV collagen and laminin with fixed negative charge from heparan sulphate), and the podocyte filtration slits bridged by nephrin. Filtration is restricted by both size (free below 7 kDa, negligible above 70 kDa) and charge (anions restricted, so albumin at 69 kDa and strongly negative is effectively excluded).

Determinants of GFR, grouped
DeterminantEffect on GFR
Renal blood flow (≈1.1 L/min, 20–25% of cardiac output)Higher plasma flow sustains P_GC and slows the rise in oncotic pressure along the capillary, so GFR rises. Filtration fraction (GFR/RPF) is normally about 0.2
Afferent arteriolar toneConstriction lowers P_GC and reduces both RBF and GFR. Dilatation raises both
Efferent arteriolar toneModerate constriction raises P_GC and increases GFR while reducing RBF — filtration fraction rises. Severe constriction reduces RBF so much that GFR falls too
Plasma protein concentrationHypoproteinaemia lowers π_GC and raises GFR; haemoconcentration does the reverse
Tubular or ureteric obstructionRaises P_BS and reduces GFR
K_fReduced by mesangial contraction and by loss of nephron mass
Diagram showing hydrostatic and oncotic pressures governing glomerular filtration
Starling forces determining glomerular filtration

b. Regulation of renal blood flow and GFR

3 marks

Renal blood flow and GFR are held remarkably constant across a wide range of arterial pressures by two intrinsic mechanisms, and are then overridden by extrinsic control when the whole circulation is threatened. Say which is which.

Intrinsic autoregulation — two mechanisms, both acting on the afferent arteriole
Myogenic responseTubuloglomerular feedback
StimulusStretch of the afferent arteriolar wall by a rise in perfusion pressureA rise in NaCl delivery to the macula densa of the thick ascending limb
SensorVascular smooth muscle itselfMacula densa cells, sensing NaCl uptake through the NKCC2 cotransporter
MediatorStretch-activated cation channels → depolarisation → Ca²⁺ entryATP and adenosine released to the mesangium, acting on A₁ receptors
ResponseAfferent arteriolar constriction, restoring flow towards baselineAfferent constriction and suppression of renin release, reducing GFR back towards baseline
SpeedFast — 3–10 secondsSlower — 30–60 seconds
When pressure fallsRelaxation and afferent dilatationReduced NaCl delivery → nitric oxide and prostaglandin release → afferent dilatation, and renin release, whose angiotensin II preferentially constricts the efferent arteriole to defend PGC

Together these hold RBF and GFR nearly constant over a mean arterial pressure of approximately 80–180 mmHg. Outside that range, flow becomes pressure-passive. Autoregulation is impaired in sepsis, in chronic kidney disease and by anaesthesia.

Extrinsic and local control
InfluenceSiteEffect
Renal sympathetic nerves (α₁)Afferent more than efferentStrong activation constricts the afferent arteriole and reduces both RBF and GFR — the renal contribution to defending systemic pressure in haemorrhage, at the cost of the kidney itself
Angiotensin IIEfferent more than afferent at moderate concentrationPreserves GFR while reducing RBF; raises filtration fraction. At high concentration constricts both and contracts mesangial cells, reducing K_f and GFR
Prostaglandins (PGE₂, PGI₂)Afferent arterioleLocally produced vasodilators that protect afferent flow during vasoconstrictor stress. This is why NSAIDs precipitate acute kidney injury in the hypovolaemic patient
Nitric oxideBoth arteriolesTonic vasodilatation, offsetting basal constrictor tone
ANPAfferent dilates, efferent constrictsRaises P_GC and GFR, promoting natriuresis. Falls in hypovolaemia
EndothelinBoth arterioles and mesangiumPotent vasoconstriction, reducing RBF, K_f and GFR. Raised in sepsis and after contrast
DopamineDA₁ receptors, renal vasculatureVasodilatation and natriuresis at low concentration. Does not prevent or treat acute kidney injury
autoregulatory range80180040801201602002400300600900050100150200GFR ceases ≈45 mmHgRenal blood flow (mL/min)GFR (mL/min)Mean arterial pressure (mmHg)Renal blood flowplateau ≈650 mL/min20–25% of cardiac outputGFRplateau ≈125 mL/minfiltration fraction ≈0.2Two mechanismsMyogenic — 3–10 sTubuloglomerularfeedback — 30–60 sBelow 80 mmHg — autoregulation is exhausted. GFR falls faster than blood flow and stops near 45 mmHg,because filtration needs P(GC) to exceed the opposing oncotic and Bowman’s pressures of about 45 mmHg.Above 180 mmHg — myogenic constriction is overcome and pressure is transmitted to the glomerulus.The range shifts right in chronic hypertension; impaired by sepsis, chronic kidney disease and anaesthesia.
Original teaching diagramAutoregulation of renal blood flow and GFR. Both are held nearly constant across a mean arterial pressure of roughly 80–180 mmHg by the myogenic response and tubuloglomerular feedback, both acting on the afferent arteriole. Note that the two curves are not the same shape below the range: filtration stops near 45 mmHg, where glomerular capillary pressure can no longer exceed the opposing forces, while blood flow continues.

c. ADH and RAAS during hypovolaemia

4 marks

State at the outset that these systems conserve sodium and water and support arterial pressure — and that ADH does not directly regulate GFR. Attributing a fall in GFR to ADH is a specific error.

Renal and hormonal conservation in hypovolaemia

Stimulus
Hypovolaemia after major surgery → ↓ effective circulating volume → ↓ renal perfusion pressure and ↓ stretch at arterial, atrial and cardiopulmonary receptors

Two hormonal limbs are activated in parallel

Limb 1 · RAAS — sodium
Renin released from juxtaglomerular cells by three signals: ↓ renal perfusion pressure, β₁ sympathetic stimulation, ↓ macula densa NaCl.
→ angiotensinogen to angiotensin IACE in pulmonary endothelium → angiotensin II.
Limb 2 · ADH — water
ADH released from the posterior pituitary. Volume depletion of more than about 8–10% overrides osmotic control, so ADH rises even when the plasma is dilute. Angiotensin II independently stimulates its release and stimulates thirst.

Actions

Angiotensin II
Systemic arteriolar constriction (↑ SVR, ↑ MAP) · preferential efferent arteriolar constriction, raising PGC and defending GFR as renal perfusion falls · ↑ proximal tubular Na⁺/H⁺ exchange · stimulates aldosterone, ADH and thirst
Aldosterone
Acts on principal cells of the late distal tubule and collecting duct. ↑ apical ENaC and basolateral Na⁺/K⁺-ATPase → sodium reabsorbed, potassium and hydrogen ion secreted. Genomic, so onset over hours
ADH
V₂ receptors on collecting-duct principal cells → Gs–cAMP–PKA → aquaporin-2 inserted into the apical membrane → water follows the medullary osmotic gradient. Also ↑ urea transporter activity, sharpening that gradient. At high concentration V₁ mediates vasoconstriction
Reinforcing
Direct renal sympathetic stimulation of proximal sodium reabsorption · withdrawal of ANP as atrial stretch falls · reduced filtered sodium load as GFR falls · peritubular Starling forces favouring reabsorption because filtration fraction has risen
Result
A low-volume, concentrated urine (osmolality above 500 mOsm/kg) with a low urinary sodium (below 20 mmol/L) and a fractional excretion of sodium below 1% — the signature of a pre-renal, sodium-avid state with intact tubular function. Extracellular volume, venous return, cardiac output and arterial pressure are restored over hours to days
Two limbs from one stimulus. RAAS conserves sodium and defends glomerular pressure; ADH conserves water. Sodium retention without water retention would raise osmolality, so the two must run together — which is why angiotensin II also stimulates ADH release and thirst.

Why the oliguria here is appropriate. A urine output below 0.5 mL/kg/h after major abdominal surgery in a volume-depleted patient is the expected result of these mechanisms working correctly, not evidence of tubular injury. The distinction matters, because the treatment is volume rather than a diuretic. A high urinary sodium and a fractional excretion above 2% would instead suggest established tubular damage.

Question 05 · 10 marks

Oxygen transport and severe anaemia

A patient with severe anaemia has a haemoglobin concentration of 6 g/dL despite a normal arterial oxygen saturation.
  1. Describe the forms in which oxygen is transported in blood. (2 marks)
  2. State the equation for arterial oxygen content and explain each component. (3 marks)
  3. Draw and describe the oxyhaemoglobin dissociation curve, including right-shift factors. (3 marks)
  4. Explain impaired tissue oxygen delivery despite normal PaO₂ and SaO₂. (2 marks)
View model answerIncludes calculation and OHDC diagrams

a. Forms of oxygen transport

2 marks

Oxygen is carried in the blood in two forms only. Give both, with the proportion each contributes and why the small one still matters.

The two forms in which oxygen is carried
Bound to haemoglobinDissolved in plasma
Proportion≈ 98–99% of total oxygen carried≈ 1–2%
Amount≈ 20 mL/dL at Hb 15 g/dL and SaO₂ 100%0.3 mL/dL at PaO₂ 100 mmHg
Governed byHaemoglobin concentration, its saturation, and the oxygen capacity of haemoglobin (1.34 mL O₂ per g, Hüfner's constant)Henry's law — directly proportional to PO₂. 0.003 mL/dL per mmHg (0.0225 per kPa)
Relationship to PO₂Sigmoid — the oxyhaemoglobin dissociation curve, because binding is cooperativeStrictly linear
ChemistryReversible oxygenation, not oxidation — iron remains ferrous (Fe²⁺). Four haem groups per tetramer, so four O₂ molecules maximum. Binding of each shifts the molecule from the tense (T) to the relaxed (R) state, raising affinity for the next — cooperativity, which produces the sigmoid shapePhysical solution in plasma water. No chemical combination
Why it mattersAlmost the entire carrying capacity. Directly proportional to haemoglobin concentration, which is the point of this questionSmall, but it is the dissolved fraction that generates the partial pressure. PO₂ drives diffusion into the tissue and determines how much binds to haemoglobin, so the dissolved fraction sets up everything the bound fraction does. It becomes therapeutically significant under hyperbaric conditions, where at 3 atmospheres about 6 mL/dL dissolves — enough to meet resting requirements without any haemoglobin at all

Hüfner's constant. The theoretical value is 1.39 mL/g from the molecular weight of haemoglobin; the in vivo figure of 1.34 is lower because a small proportion of circulating haemoglobin is methaemoglobin or carboxyhaemoglobin and cannot carry oxygen. Use 1.34 in calculations, and say why if asked.

b. Arterial oxygen content

3 marks
CaO₂ = (1.34 × Hb × SaO₂) + (0.003 × PaO₂)CaO₂ in mL O₂/dL; Hb in g/dL; SaO₂ as a fraction; PaO₂ in mmHg. In kPa the dissolved coefficient is 0.0225.
Each component of the oxygen content equation
TermMeaningUnitsNormalNotes
CaO₂Arterial oxygen content — total oxygen carried per unit volume of bloodmL O₂/dL≈ 20 mL/dLThe quantity that actually matters to the tissue. Not measured by the pulse oximeter or the blood gas machine directly
1.34Hüfner's constant — oxygen bound per gram of fully saturated haemoglobinmL O₂/g1.34Theoretical 1.39; the lower in vivo value allows for dyshaemoglobins
HbHaemoglobin concentrationg/dL13–17 (M), 12–15 (F)The dominant variable. Halving it halves content. This is the answer to part (d)
SaO₂Fractional saturation of available haemoglobin binding sitesfraction (0–1)0.97–0.98A ratio, not an amount. Enter 0.98, not 98 — a common arithmetic slip. Says nothing about how much haemoglobin is present
0.003Solubility coefficient of oxygen in plasma at 37 °CmL/dL/mmHg0.003Henry's law constant. Use 0.0225 if PaO₂ is in kPa
PaO₂Arterial partial pressure of oxygen — the tension of the dissolved fractionmmHg80–100Determines saturation via the dissociation curve, and drives diffusion into the tissues
Worked comparison — this patient against normal

This patient, Hb 6 g/dL, SaO₂ 1.00, PaO₂ 100 mmHg:
CaO₂ = (1.34 × 6 × 1.00) + (0.003 × 100) = 8.04 + 0.30 = 8.34 mL/dL

Normal, Hb 15 g/dL, same saturation and tension:
CaO₂ = (1.34 × 15 × 1.00) + 0.30 = 20.1 + 0.30 = 20.4 mL/dL

Content is 41% of normal with a completely normal saturation and a completely normal PaO₂. If cardiac output is 5 L/min, DO₂ falls from about 1020 to 417 mL/min — below the usual 1000 mL/min and approaching the critical threshold of roughly 300 mL/min at which delivery becomes supply-dependent.

c. The oxyhaemoglobin dissociation curve

3 marks
0204060801000255075100P50 26.61936v̄ 40 mmHg, 75%a 100 mmHg, 97–98%Haemoglobin saturation (%)Oxygen partial pressure, PO₂ (mmHg)NormalRight shiftLeft shiftPlateau > 60 mmHgloading protectedSteep 20–60 mmHgunloading at tissueRight shift → ↑P50, ↓affinity, oxygen given up more readily↑H⁺ (↓pH) · ↑PCO₂ · ↑temperature · ↑2,3-DPG — the warm, acidotic, working tissueLeft shift → ↓P50, ↑affinity, oxygen held on to↓H⁺ · ↓PCO₂ · ↓temperature · ↓2,3-DPG · HbF · carboxyhaemoglobin · methaemoglobin
Original teaching diagramThe oxyhaemoglobin dissociation curve. Label both axes with units, mark P50 ≈ 26.6 mmHg, and show the steep portion at tissue tensions and the plateau above about 60 mmHg. A right shift moves the curve down and to the right: at any given PO₂ the saturation is lower, P50 is higher, affinity is reduced, and oxygen is released to the tissues more readily.
Reading the curve — the points that earn marks
FeatureDetail
Axesy-axis: haemoglobin saturation, %. x-axis: PO₂ in mmHg (or kPa). Label both with units — an unlabelled graph earns little
ShapeSigmoid, from cooperative binding: oxygenation of one haem shifts the tetramer from the tense to the relaxed state, increasing affinity at the remaining sites. The Hill coefficient is about 2.7
P5026.6 mmHg (3.5 kPa) at pH 7.4, PaCO₂ 40 mmHg, 37 °C. The index of affinity: a higher P50 means lower affinity
Upper plateauAbove about 60 mmHg the curve is flat, so saturation is well defended against a falling PaO₂ — but also means supplemental oxygen adds little content once saturation is high, and that large falls in PaO₂ occur before the oximeter changes
Steep portionBetween about 20 and 60 mmHg. At tissue PO₂ a small fall in tension releases a large amount of oxygen. This is where unloading happens
Arterial pointPO₂ 100 mmHg, SaO₂ 97–98%, content ≈ 20 mL/dL
Mixed venous pointPO₂ 40 mmHg, SvO₂ 75%, content ≈ 15 mL/dL. The difference of about 5 mL/dL is the resting extraction of roughly 25%

The rightward shift, properly explained

A right shift means that at any given PO₂ the saturation is lower. The curve moves down and to the right; P50 rises; the affinity of haemoglobin for oxygen falls; and oxygen is therefore released more readily to the tissues. Note carefully what this does not mean: it does not reduce the oxygen content of arterial blood appreciably, because at a PaO₂ of 100 mmHg the curve is on its plateau and saturation is still near 97%. The whole effect is exerted at the tissue end, on the steep part of the curve, where the same fall in PO₂ now unloads more oxygen.

Causes of a shift, and the mechanism of each
DirectionCauseMechanism
Right↑ H⁺ (↓ pH) — the Bohr effectH⁺ binds to histidine residues on the globin chains, stabilising the tense low-affinity state
Right↑ PCO₂Two mechanisms: generation of H⁺ through carbonic anhydrase, and direct formation of carbamino compounds with terminal amine groups, which also stabilise the T state
Right↑ temperatureWeakens the oxygen–haem bond; the association is exothermic, so heat drives it in reverse
Right2,3-DPGA glycolytic intermediate that binds in the central cavity between the β chains, cross-linking them in the T state. Raised in chronic anaemia, chronic hypoxia, altitude, hyperthyroidism and pregnancy — a relevant compensation in this patient
RightSickle haemoglobin (HbS)Reduced affinity relative to HbA
Left↓ H⁺, ↓ PCO₂, ↓ temperature, ↓ 2,3-DPGThe converse of each mechanism above. Stored blood is depleted of 2,3-DPG, so transfused red cells initially unload poorly
LeftFetal haemoglobin (HbF)γ chains replace β chains and bind 2,3-DPG poorly, so HbF has a higher affinity (P50 ≈ 19 mmHg). This lets the fetus extract oxygen across the placenta from maternal blood
LeftCarboxyhaemoglobinCO binds with about 240 times the affinity of oxygen, reducing capacity, and additionally shifts the curve for the remaining sites to the left, impairing unloading. A doubly damaging lesion
LeftMethaemoglobinFerric (Fe³⁺) haem cannot bind oxygen and shifts the remaining ferrous sites left

The physiological elegance. Actively metabolising tissue is warm, acidotic and hypercapnic — exactly the conditions that shift the curve right and release more oxygen precisely where it is needed. In the pulmonary capillary the reverse holds: CO₂ is excreted, pH rises, the curve shifts left and loading is favoured. The same molecule adapts its affinity to the environment at each end of the circulation.

d. Why oxygen delivery is impaired

2 marks
DO₂ = CO × CaO₂ × 10DO₂ in mL/min; CO in L/min; CaO₂ in mL/dL. The factor of 10 converts decilitres to litres. Normal ≈ 5 × 20 × 10 = 1000 mL/min.
Why three normal numbers can still mean inadequate delivery
MeasurementThis patientWhat it actually describes
PaO₂NormalThe tension of the dissolved fraction — 1–2% of the total. It says how well the lung is transferring oxygen, nothing about how much is carried
SaO₂NormalThe proportion of available binding sites occupied. A percentage of whatever haemoglobin is there. 100% of a small number is still a small number
Hb6 g/dL — the lesionThe number of binding sites. It alone sets the capacity, and neither of the two measurements above reflects it
CaO₂8.3 mL/dL (41% of normal)The amount of oxygen actually present per decilitre
DO₂417 mL/min at CO 5 L/minThe amount reaching the tissues each minute. Normal ≈ 1000 mL/min; consumption ≈ 250 mL/min

Compensation, and where it fails. Cardiac output rises — largely through increased stroke volume, helped by the fall in viscosity and therefore in afterload. Flow is redistributed towards heart and brain. Tissue extraction increases, so the mixed venous saturation falls below 75% and the arteriovenous content difference widens. 2,3-DPG rises over 12–24 hours, shifting the curve right and improving unloading.

These are effective until they are exhausted. Oxygen consumption is normally independent of delivery, because extraction rises as delivery falls. Below a critical DO₂ of roughly 300 mL/min extraction is maximal and consumption becomes supply-dependent: VO₂ falls with any further fall in delivery, cells switch to anaerobic metabolism, and lactate rises. This patient, at about 417 mL/min at rest with a normal cardiac output, has little reserve — anaesthesia, which blunts the compensatory tachycardia and inotropy, or any further blood loss, moves them towards that threshold.

Question 06 · 10 marks

Cardiovascular and respiratory physiology of pregnancy

A healthy woman presents for elective surgery at 34 weeks of pregnancy.
  1. Describe the major cardiovascular changes during pregnancy. (4 marks)
  2. Describe the major respiratory changes during pregnancy. (4 marks)
  3. Explain the physiological basis of supine hypotension in late pregnancy. (2 marks)
View model answerIncludes values and clinical significance

a. Cardiovascular changes

4 marks

Four marks needs direction, magnitude and mechanism for each variable — a direction alone is half an answer. Percentages are what distinguish a strong script.

Cardiovascular changes at term, with magnitude and mechanism
VariableChangeMechanismSignificance
Plasma volume↑ 45–50%Oestrogen- and RAAS-mediated sodium and water retention; aldosterone rises severalfoldReserve against delivery-related blood loss
Red cell mass↑ 20–30%Erythropoietin-driven erythropoiesis; less than the plasma riseIron requirement roughly doubles
Total blood volume↑ 35–45%The sum of the two aboveBlood loss of 500 mL (vaginal) or 1000 mL (caesarean) is usually well tolerated
Haemoglobin↓ to 11–12 g/dLDilution — plasma expansion exceeds red cell expansion: physiological anaemia of pregnancy, not a true anaemiaViscosity falls, improving placental flow. Oxygen content falls slightly but delivery is maintained by increased output
Cardiac output↑ 30–50%Rises from around 5 weeks; plateaus at 30–34 weeksIncreases a further 15% in the first stage of labour, 50% in the second, and up to 80% immediately after delivery
Heart rate↑ 15–25% (about 10–20 beats/min)Increased sympathetic tone; earliest contributorReduces diastolic filling time — poorly tolerated in mitral stenosis
Stroke volume↑ 20–30%Increased preload from the expanded volume, plus ventricular remodellingThe dominant contributor to the rise in output in the second and third trimesters
SVR↓ 20–30%Progesterone, prostacyclin and nitric-oxide-mediated vasodilatation, plus the low-resistance uteroplacental bed acting as an arteriovenous shuntThe primary change; the rise in output largely follows it
Blood pressure↓ 10–15 mmHg diastolic, nadir at 20–24 weeks, returning to baseline by termFall in SVR exceeds the rise in output; diastolic falls more than systolic so pulse pressure widensA pressure that is 'normal' at 24 weeks may represent hypertension
CVP and PCWPUnchangedVenous capacitance expands in parallel with volumeFilling pressures do not reflect the expanded volume
Uterine blood flow↑ from 50 to 700–900 mL/min (10% of output)Maximally dilated and therefore pressure-dependentHas no autoregulation — maternal hypotension translates directly into fetal hypoperfusion
Anatomy and ECGHeart displaced up and left, rotatedDiaphragmatic elevationLeft axis deviation, T inversion in III and V1–V2, ectopics; an apparently enlarged heart on chest radiograph
CoagulationHypercoagulable↑ factors I, VII, VIII, IX, X, XII and fibrinogen; ↓ protein S; ↑ PAI-1 and PAI-2Limits postpartum haemorrhage, at the cost of a several-fold increase in thromboembolic risk

b. Respiratory changes

4 marks
Respiratory changes at term, with magnitude and mechanism
VariableChangeMechanismSignificance
DiaphragmRises about 4 cmEnlarging uterusChest wall compensates: AP and transverse diameters increase about 2 cm, subcostal angle widens. Diaphragmatic excursion is preserved or increased
Airway mucosaOedematous, friable, capillary engorgementOestrogen, increased blood volumeDifficult intubation is several times more likely; use a smaller tube (6.0–7.0), avoid nasal instrumentation, expect bleeding. Worse in pre-eclampsia and after prolonged pushing
Tidal volume↑ 40–45%Progesterone-drivenThe main mechanism of increased ventilation
Respiratory rate↑ 0–10%, little changeTachypnoea is not a normal finding and should be investigated
Minute ventilation↑ 45–50%Almost entirely from tidal volumeBegins in the first trimester
Alveolar ventilation↑ 50–70%Tidal volume rises proportionally more than dead spaceDrives the fall in PaCO₂
FRC↓ 20% upright, ↓ up to 30% supineDiaphragmatic elevation reduces ERV and residual volumeLoss of the principal oxygen store. Combined with raised consumption this is the single most important anaesthetic change
ERV / RV↓ 20–25% eachAs aboveContribute the whole of the FRC reduction
Closing capacityUnchangedBut FRC falls towards it, so airway closure occurs during tidal breathing in up to half of women when supine — causing shunt and worsening hypoxaemia
Vital capacity / TLCVC unchanged; TLC ↓ slightlyChest wall compensation preserves VCSpirometry is largely preserved; FEV₁ and peak flow unchanged, so asthma assessment is unaffected
Oxygen consumption↑ 20–35% at rest, up to 60% in labourFetus, uterus, placenta, respiratory and cardiac workCombined with reduced FRC, gives desaturation within 2–3 minutes of apnoea against 6–8 in the non-pregnant
PaCO₂↓ to 28–32 mmHgProgesterone increases the sensitivity and resets the threshold of the central chemoreceptorsA PaCO₂ of 40 mmHg at term indicates relative hypoventilation and may signal impending respiratory failure
PaO₂↑ slightly, 100–105 mmHgIncreased alveolar ventilation raises PAO₂ via the alveolar gas equationFavours placental oxygen transfer
Acid–baseCompensated respiratory alkalosis: pH 7.40–7.45, HCO₃⁻ 18–21 mmol/L, base excess −2 to −3Renal bicarbonate excretion compensates over daysBuffering capacity is reduced, so acidosis develops faster in labour or haemorrhage. The mild alkalosis favours fetal CO₂ offloading

Tying it together for the anaesthetist: a smaller oxygen store, a higher rate of consumption, an airway that is more difficult and more likely to bleed, and a reduced buffering reserve. Preoxygenate thoroughly, plan for a difficult airway, and treat the margin for apnoea as roughly half of what it would otherwise be.

c. Supine hypotension

2 marks

Definition: supine hypotension syndrome is a fall in maternal arterial pressure — conventionally a drop in systolic pressure of more than 15–30 mmHg with symptoms — occurring when a woman beyond about 20 weeks lies supine, and relieved by lateral positioning. It is symptomatic in roughly 8–10% of women at term, while aortocaval compression itself occurs in almost all.

Aortocaval compression — mechanism and compensation

Anatomy
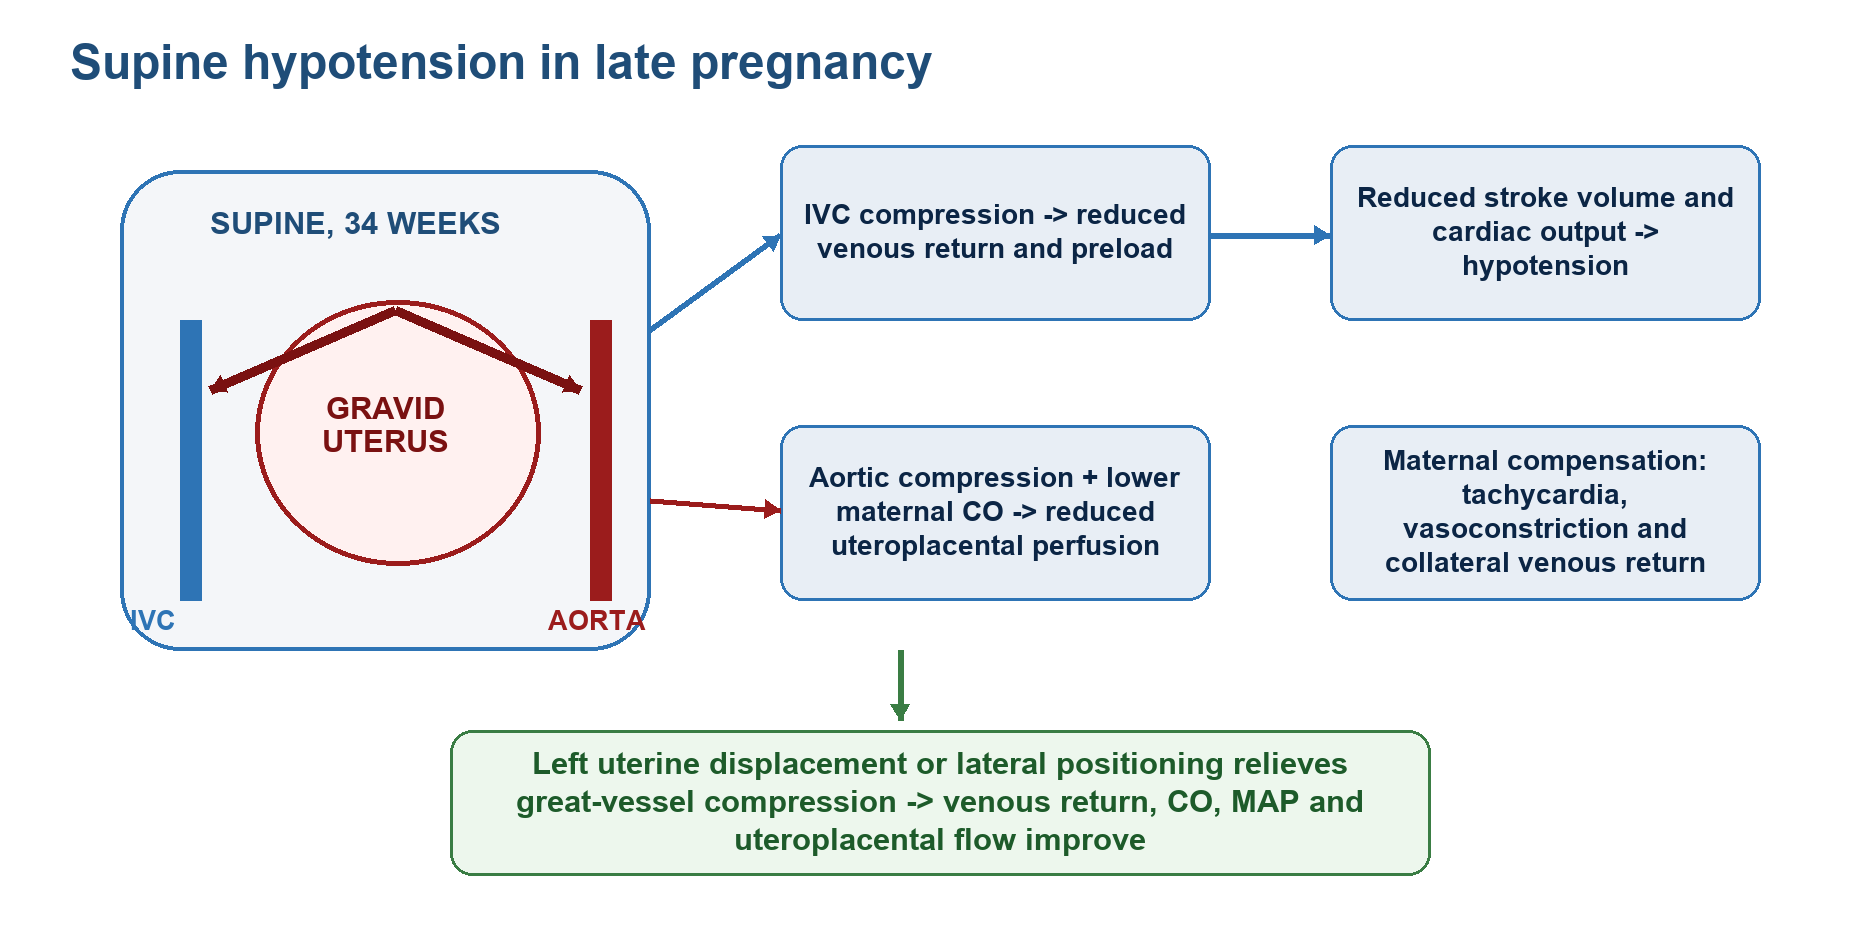
From about 20 weeks the gravid uterus is heavy enough that, supine, it compresses the inferior vena cava against the vertebral column at L4–L5. The IVC lies to the right of the midline, which is why left lateral tilt relieves it

Two vessels are compressed, with different consequences

IVC — the main effect
↓ venous return → ↓ right atrial pressure and preload → ↓ EDV → by Frank–Starling, ↓ stroke volume → ↓ cardiac output by 10–20% → ↓ MAP
Aorta — the hidden effect
Compression of the distal aorta and common iliac arteries reduces flow below the level of compression. Brachial pressure may be normal while uterine and lower-limb perfusion are already reduced — so a reassuring cuff reading does not exclude fetal compromise
Collateral
Blood diverts through the azygos, paravertebral, epidural and vertebral venous plexuses. These engorge, which reduces the epidural and subarachnoid space volume — the reason neuraxial local anaesthetic requirement falls by about a third

The awake, unanaesthetised woman compensates

Reflex
Baroreceptor-mediated tachycardia and vasoconstriction increase SVR and largely maintain arterial pressure
Collateral flow
Venous return is partly maintained through the collateral channels described above
Behaviour
Symptoms — nausea, pallor, sweating, dizziness, dyspnoea — prompt her to turn, which is itself the most effective compensation
Why anaesthesia unmasks it
Neuraxial block produces a sympathectomy that abolishes both the tachycardia and the vasoconstriction. General anaesthesia blunts baroreceptor reflexes and causes vasodilatation and myocardial depression. The compensations disappear precisely when they are most needed, and profound hypotension can follow within minutes
Fetal consequence
Uteroplacental blood flow is pressure-dependent and not autoregulated, and the placental vessels are already maximally dilated. Any fall in maternal MAP therefore transmits directly to the fetus, producing hypoxia, acidosis and fetal heart rate abnormalities
Management
Left uterine displacement — 15° left lateral tilt, a wedge under the right hip, or manual displacement — from 20 weeks onwards for every supine woman. Add fluid loading and a vasopressor (phenylephrine preferred; it preserves fetal pH better than ephedrine, which crosses the placenta and increases fetal metabolic rate) when a neuraxial block is placed. During resuscitation, manual left uterine displacement is maintained throughout chest compressions
The important clinical point sits in the last two rows: the awake woman compensates, and anaesthesia removes exactly those compensations. That is why the syndrome so often becomes apparent only after induction or after a neuraxial block.
Diagram showing aortocaval compression and supine hypotension in late pregnancy
Aortocaval compression and supine hypotension
Connecting…
Account progress

Connecting your study progress…

Account & profile